For logging in our Kubernetes we use the Grafana Loki stack, this includes Loki as logging backend, promtail for the logging agent/collector and Grafana as frontend.
Loki is described as “Like Prometheus, but for logs“, in the sense that it uses Kubernetes labels in the same way as Prometheus does. Loki aims for cost effectiveness and easy operation.
We use the following Helm installation, but is managed by ArgoCD:
helm upgrade --install loki grafana/loki-stack --namespace=logging --set promtail.enabled=true,loki.persistence.enabled=true,loki.per
sistence.storageClassName=longhorn,loki.persistence.size=5Gi
The Loki data source can now be added in Grafana with the following URL or can be done automatically with a ConfigMap for Grafana: http://loki.logging.svc.cluster.local:3100
See it already live at: https://grafana.dev-jointcyberrange.nl/
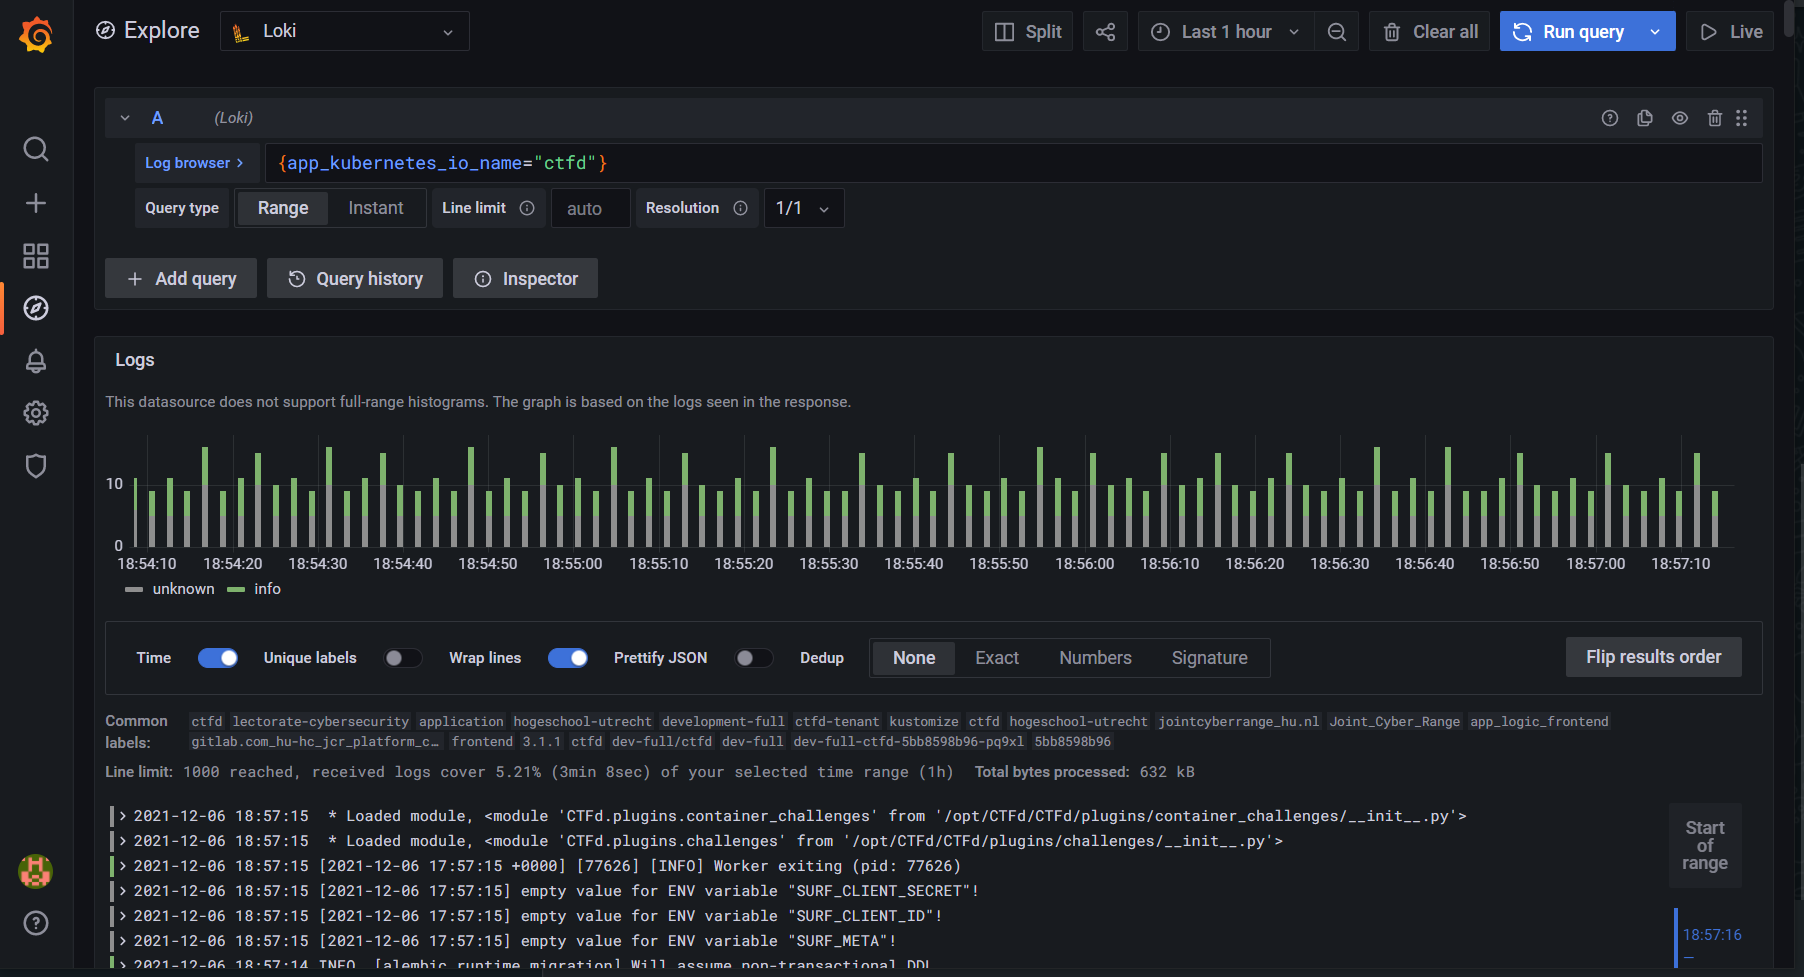
Click on Explore in the menu on the left:
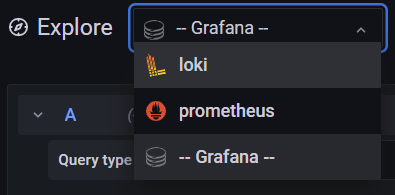
Select Loki as data source to exlore in the top left corner:
Click on the Log browser button:
Select the desired Kubernets labels to extract logs from:
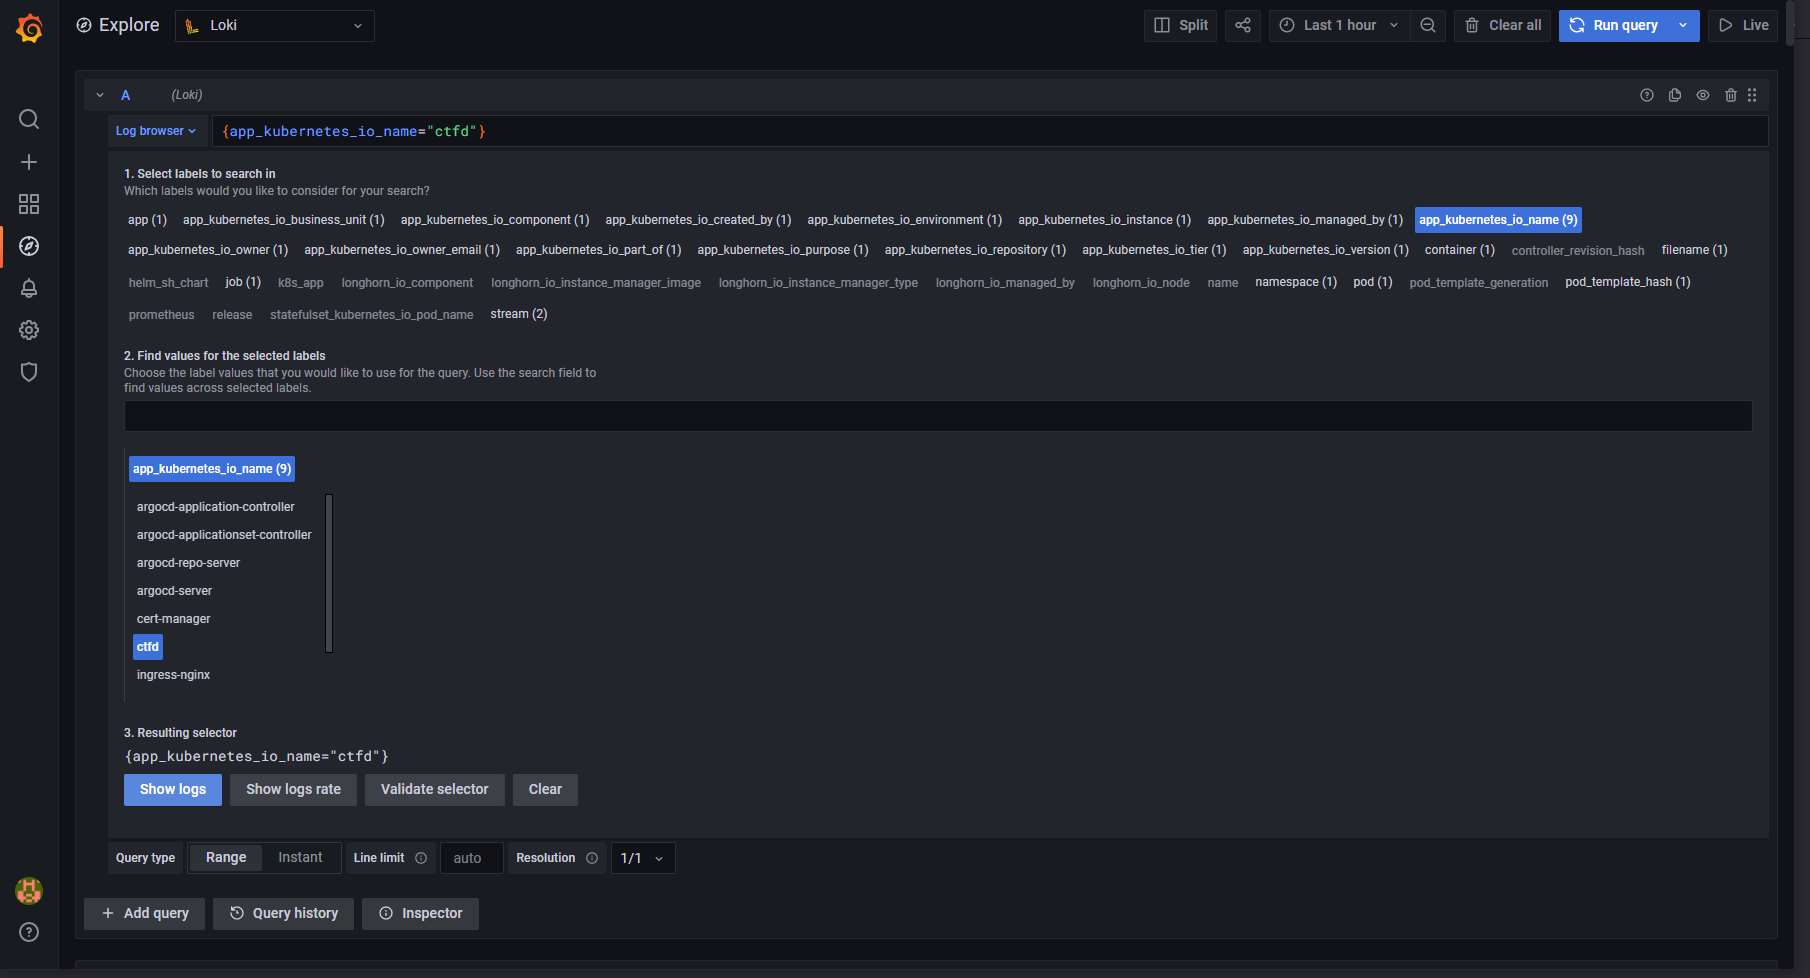
Click on the Show logs button:
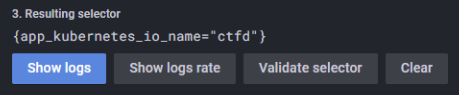
Your logs will now appear:
The LogCLI is an alternative interface that can interact with the Loki API. To access Loki with the LogCLI, Loki will have to be exposed. Loki doesn’t support a native authentication method and has to be implemeted in combination with a reverse proxy or other technique. For this we use the NGINX Ingress Controller and enabled HTTP Basic Authentication.
Install the LogCLI by following the documentation at: https://grafana.com/docs/loki/latest/getting-started/logcli/
The LogCLI can be used as followed:
export LOKI_ADDR=https://loki.dev-jointcyberrange.nl
export LOKI_USERNAME=loki-username
export LOKI_PASSWORD=loki-passowrd
logcli --tls-skip-verify query '{app_kubernetes_io_name="ingress-nginx"}'